Hello! I'm a 4th year PhD Student
at the University of Pittsburgh
I use Machine Learning and AI to understand the Universe
List of Publications
Research
I am interested in applying machine learning (neural networks, CNNs, contrastive learning, Generative AI, transformers)
to large astronomical datasets.
A key ingredient to studying cosmology and galaxy evolution is knowing distances to galaxies, which is the primary focus of my research.
I am part of the Dark Energy Spectroscopic Instrument (DESI) Collaboration,
and the Legacy Survey of Space and Time Dark Energy Science Collaboration (LSST DESC).
Some of the projects I have worked on include:
- estimating distances to galaxies from space-based images using semi-supervised deep dearning;
- predicting the emission lines of galaxies from their stellar continua with a JAX-implemented Multi-Layer Perceptron trained on DESI data;
- and detecting gravitational waves in noisy data using generative AI.
JAX Neural Network to Predict Galactic Neon Lights
Published in MNRAS
If you've ever seen images of spiral galaxies, you might have noticed glowing red or pink spots sprinkled throughout.
These galactic neon lights are actually clouds of hydrogen gas, lit up by the intense radiation of young, massive stars.
The process is similar to how neon signs work—except instead of electricity exciting the gas, it's starlight!
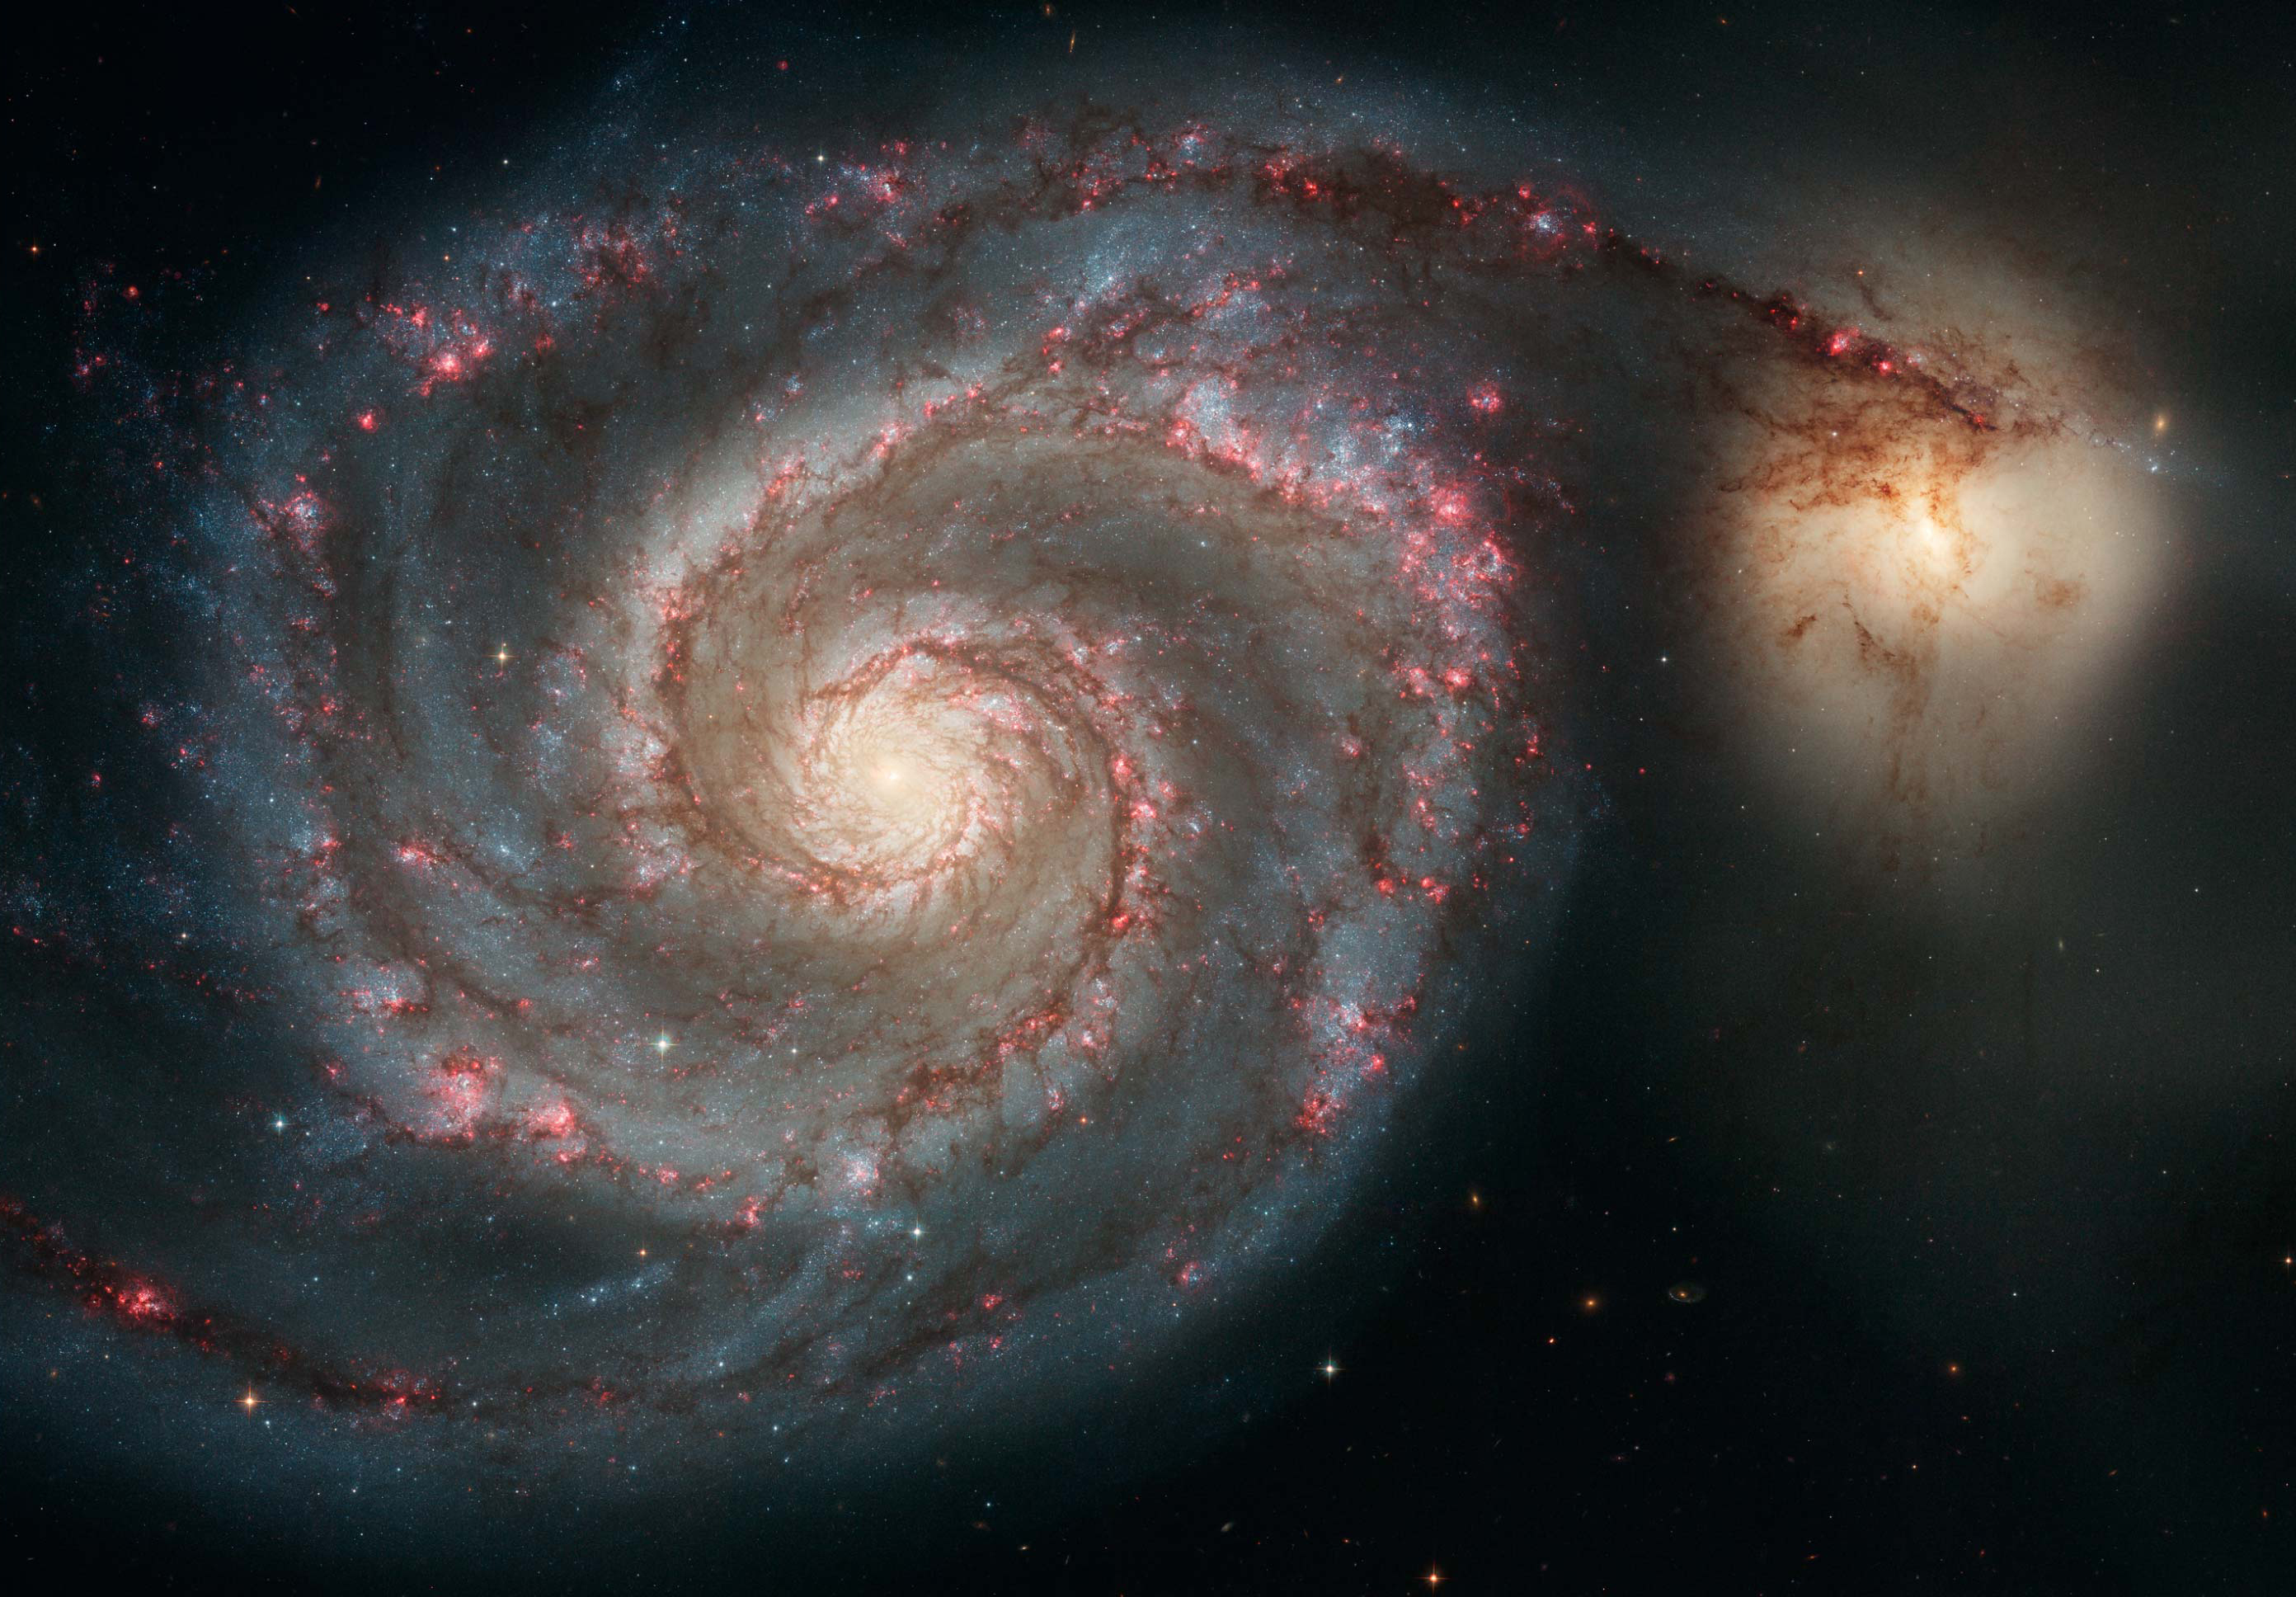
If starlight is responsible for these glowing regions, can a neural network predict them from the surrounding stellar light?
In this project, we trained a JAX-implemented neural network on
DESI early data release to predict the strengths of emission lines (or neon lights) of galaxies from their starlight.
When the light from a galaxy is split into its constituent wavelengths, it produces a spectrum.
Most of the light comes from stars, which produce a smooth spectrum, and the neon lights coming from gas appear as spikes on top of the smooth spectrum.
These spikes are called emission lines.
This project shows that these two sources are strongly correlated.
This is not surprising - emission lines are produced when the gas is ionized by the light emitted from the stars.
Also, the starlight holds information on the history of star formation of the galaxy, which is what determines
the content of the gas.
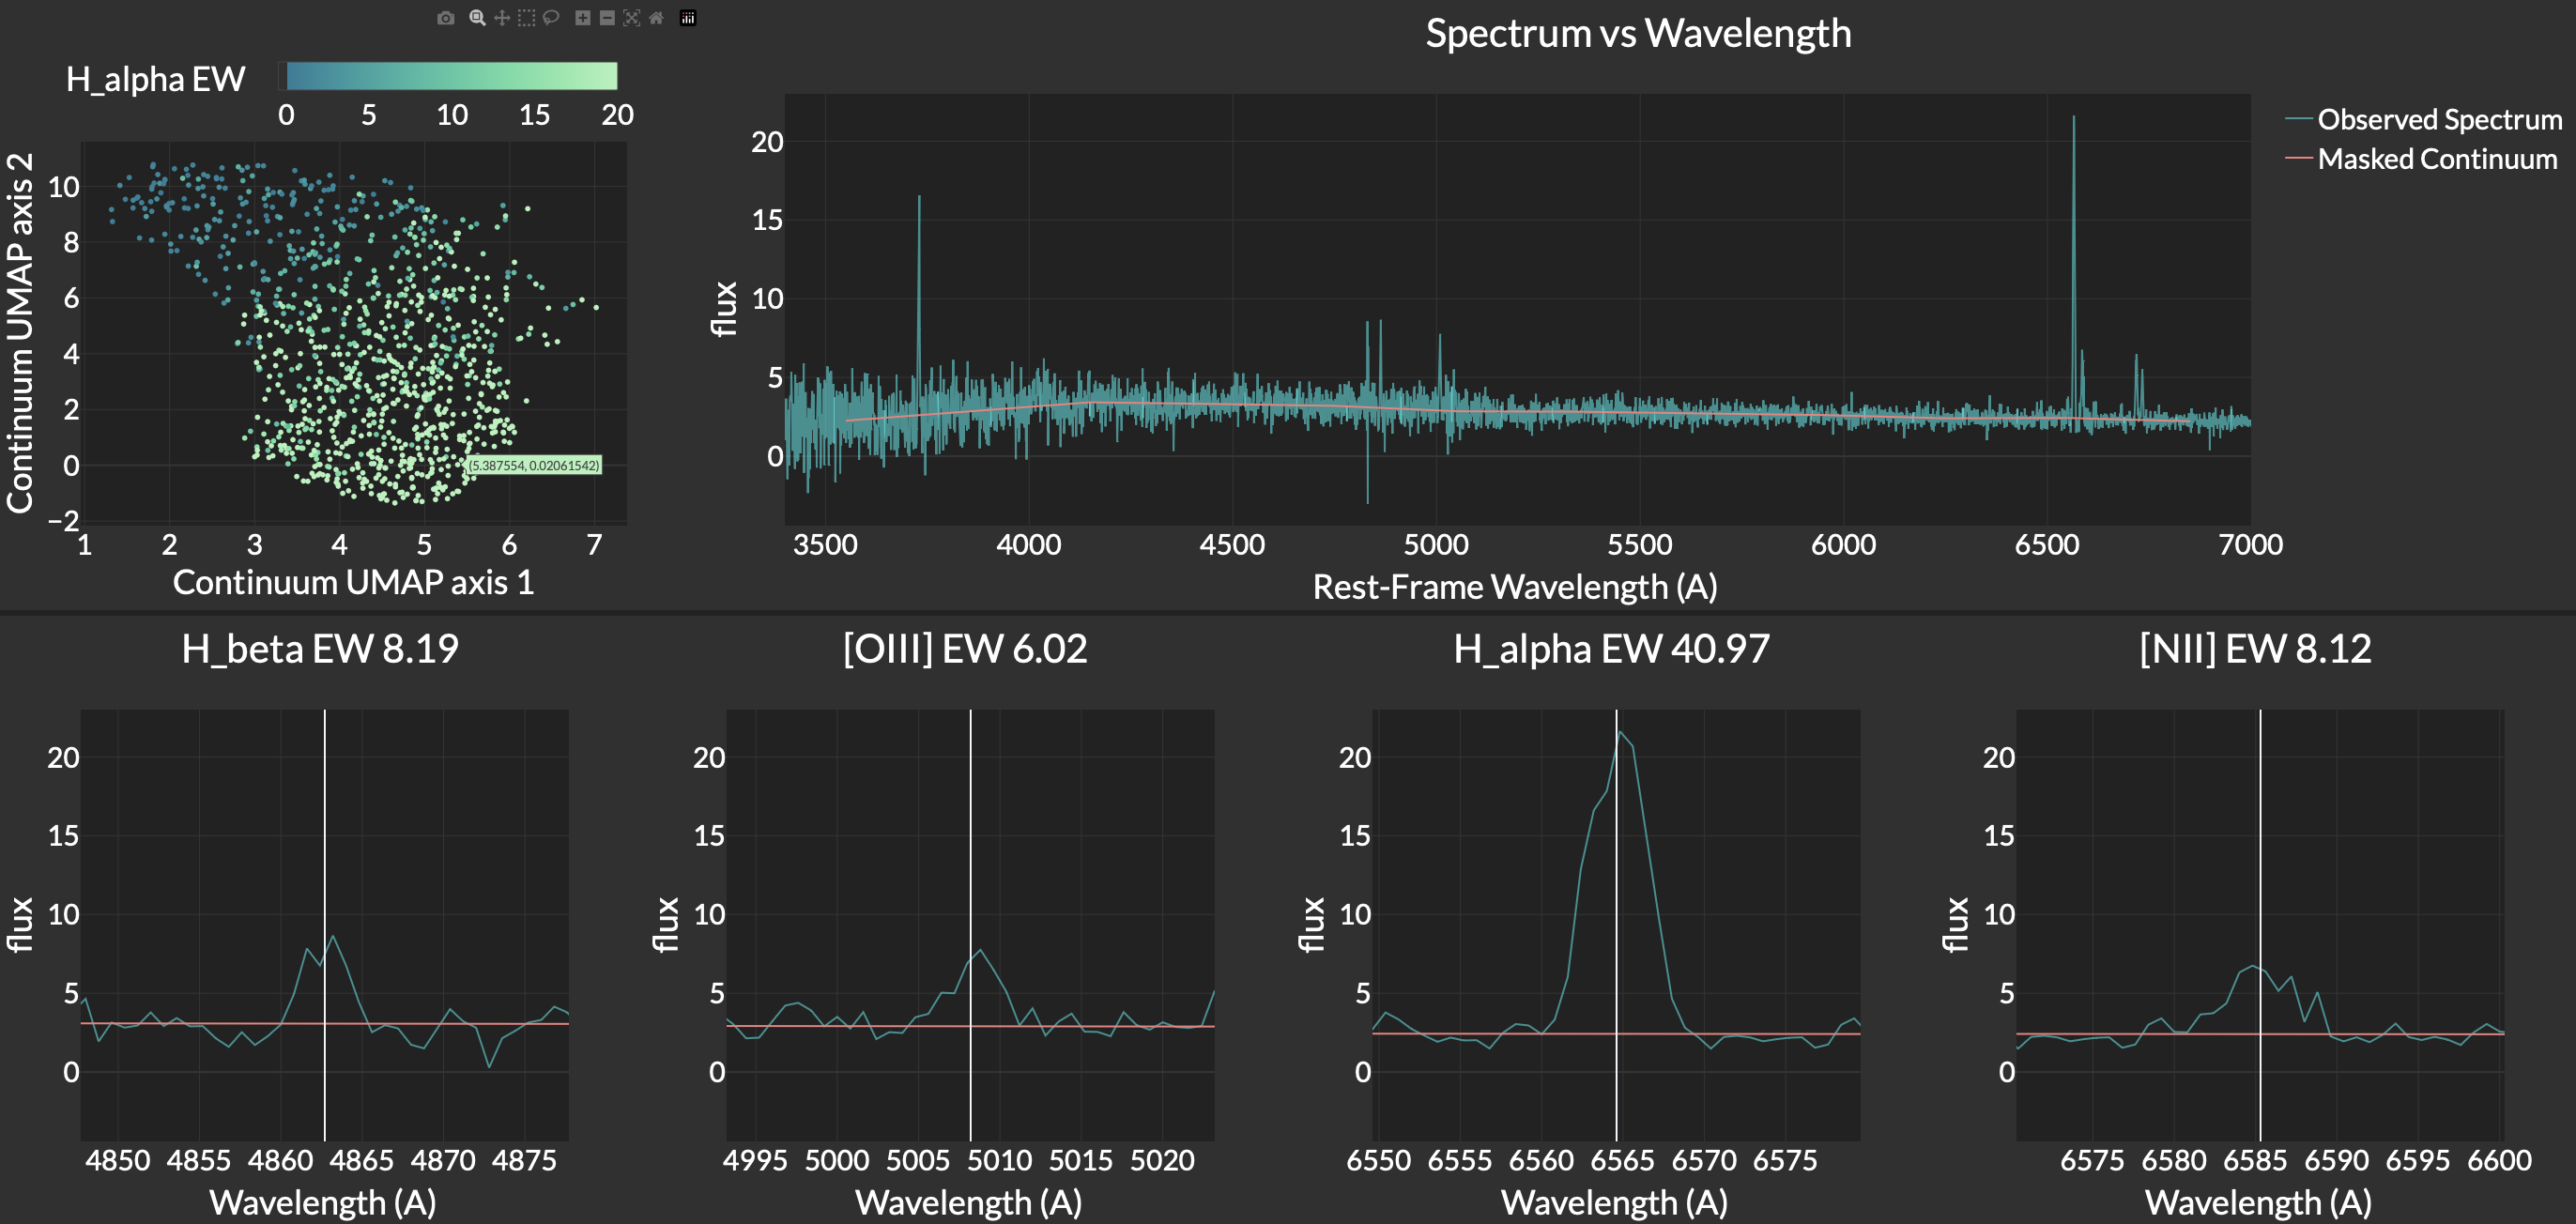 To visualize this correlation, I created an interactive plot using Dash and Plotly.
The top-left panel in the figure above shows a 2D projection of the starlight (using UMAP), with 1,000 galaxies being represented as scatter points
color-coded with the strength of the strongest emission line, H-alpha. There is a clear trend from weak to strong H-alpha emission.
The galaxies with strong H-alpha emission are the ones with the youngest stars (which have blue continua),
and the galaxies with weak H-alpha emission are the ones with the oldest stars (which have red continua).
The top-right panel shows the spectrum of a particular galaxy, and the bottom four panels show some of its emission lines.
This galaxy has a blue spectrum (the flux is strongest at shorter wavelengths), and it also has strong emission lines.
You can checkout an interactive version of this plot at this link (it might take some time to load).
By hovering over the points in the scatter plot of the top-left panel, you will find that galaxies
with a red spectrum (more flux at longer wavelengths) will have weak emission lines.
Estimating Distances to Galaxies from Space-based Images Using Semi-Supervised Deep Learning
Talk at AstroAI 2024
In this project, I develoepd a semi-supervised deep learning algorithm to improve distance estimates of far-away galaxies
(redshifts > 0.3).
Galactic distances are a key ingredient to understanding how the universe and galaxies formed and evolved.
However, measuring distances reliably involves a resource-intensive method called spectroscopy. A more efficient (but less accurate) method is to estimate distances from galaxy images.
With reliable spectroscopic measurements for a fraction of imaged galaxies, it is possible to train machine learning algorithms to estimate the distances of the remaining galaxies.
Deep Convolutional Neural Networks (CNNs) have been shown to be very effective at estimating distances
to nearby galaxies from their ground-based images. However, these methods have not been tested for more distant galaxies due to limited training data.
This is because of two main reasons: 1) For deep learning to make use of the images, the galaxies must be resolved. For distant galaxies, this requires space-based images.
2) Since distant galaxies are faint, it is difficult to obtain distance measurements for them in a reliable way, which are the labels needed to train deep learning models.
Upcoming space-based observatories, such as the
Nancy Grace Roman Space Telescope,
will resolve the first of these issues by providing high-resolution images of hundreds of millions of distant galaxies. A fraction of these galaxies will also have reliable
distance measurements from ground-based spectroscopic instruments. Therefore, it will be possible to train deep learning algorithms to estimate
distances for the remaining galaxies.
In this project, we curated a catalog of ~100,000
Hubble Space Telescope (HST)
images, ~20,000 of which have reliable distance labels, to test deep learning algorithms in preparation for future observatories.
In particular, we can test algorithms that we would apply to Roman data on HST data, since they are similar in spatial resolution and depth.
Our results show that a semi-supervised deep learning approach which makes use of unlabeled images outperforms fully supervised
methods and traditional (not deep learning) estimates (both of which require redshift labels for all objects used in training). For bright galaxies,
our method reduces bias by 87%, normalized median absolute deviation by 20%, and fraction of outliers by 47% compared to predictions from traditional methods
(these are key metrics for assessing the performance of distance-estimating algorithms).
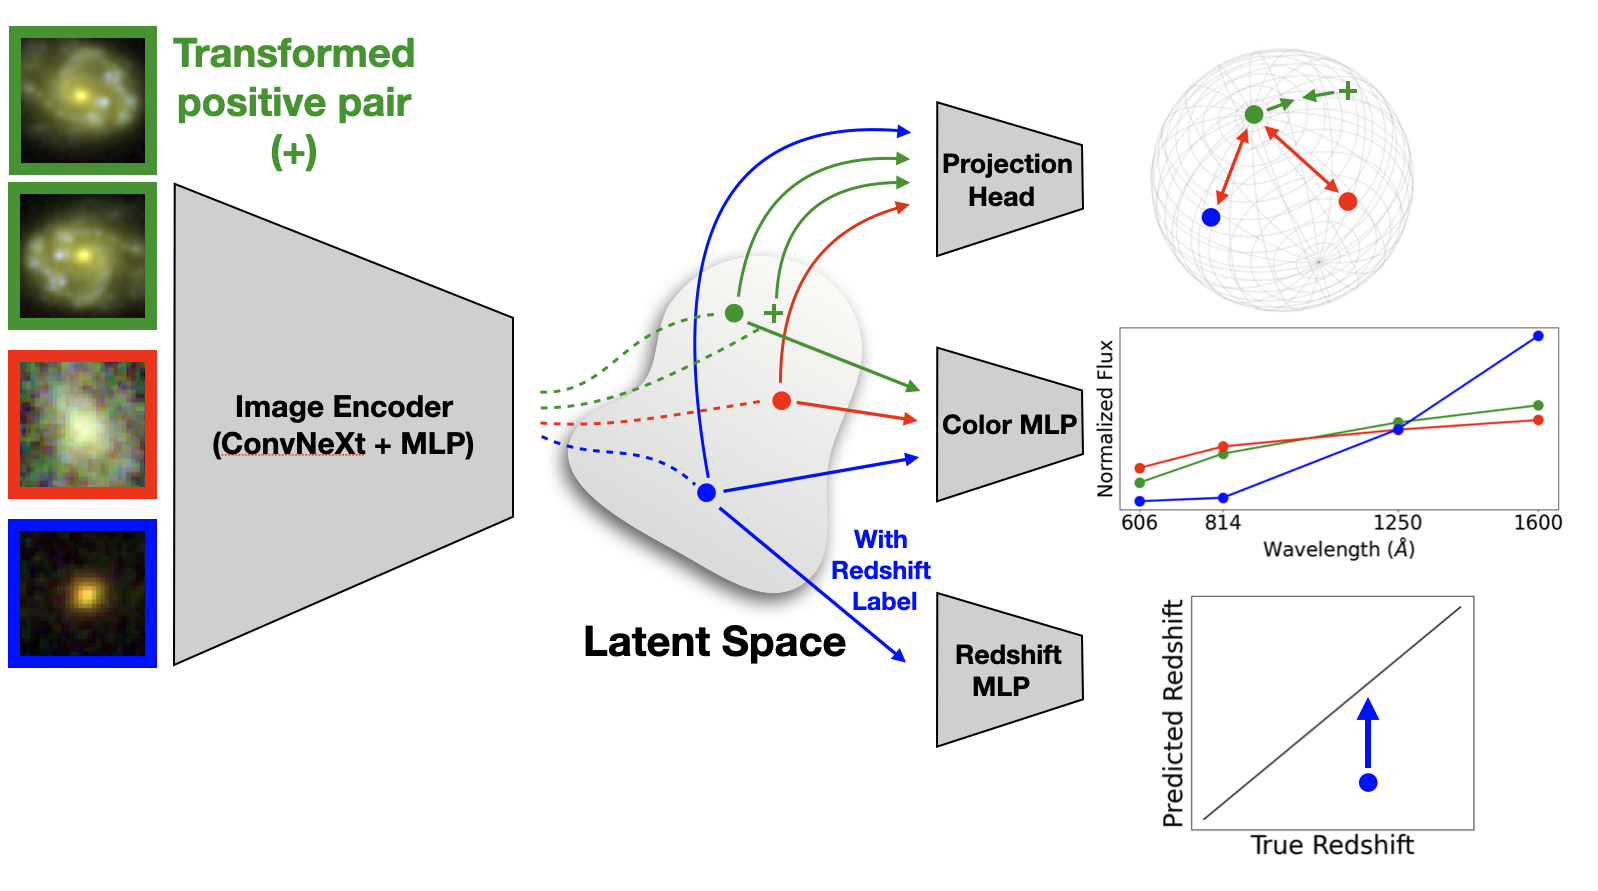
Our algorithm learns a low-dimensional representation of images by using unlabeled images with a color prediction loss and a contrastive learning loss.
The labeled images are used with an additional distance prediciton loss to align the low-dimensional representation and make it ideal for distance prediction.
The below figure shows the architecture of the model.
 Traditional methods only use the colors of galaxies to predict distances (or redshifts). By using the images directly, our algorithm also leverages
pixel-level information (including morphology) to improve distance estimates. This is illustrated in the figure below.
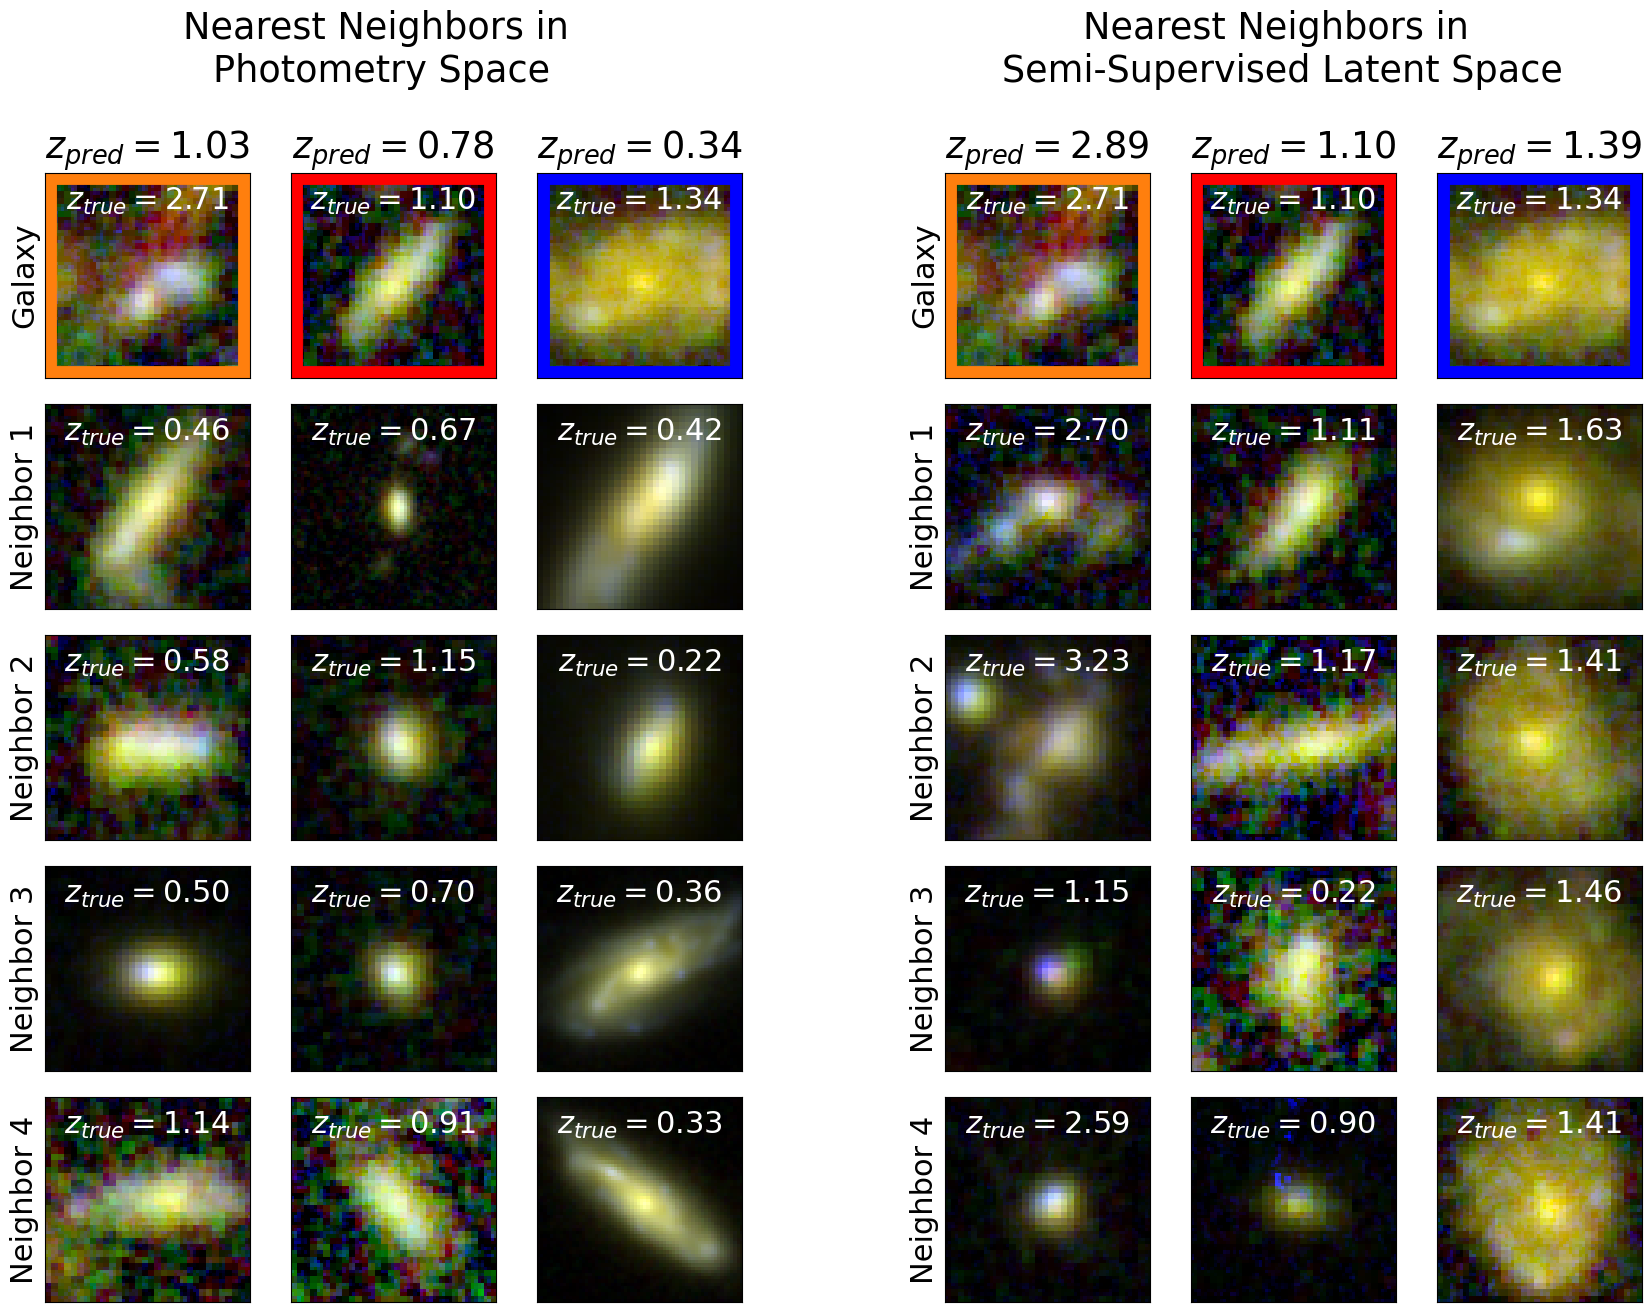 The top row shows three galaxies in our test set that have incorrect predictions from traditional methods, but correct predictions from our method.
This is because other galaxies with the same colors (shown as the negibhors in photometry space), but not necessarily the same morphologies, have different distances (z_true). However, galaxies with the same colors
and the same morphologies (shown as neighbors in the semi-supervised latent space) have similar distances.
Detecting Gravitational Waves with Generative AI
Instruments that are used to detect Gravitational Waves (GWs), like the
Laser Interferometer Gravitational Wave Observatory (LIGO),
are very sensitive, making them susceptible to noise (including vibrations in the mirrors, earthquakes, and even traffic!). This makes it difficult
to differentiate between real GWs and noise.
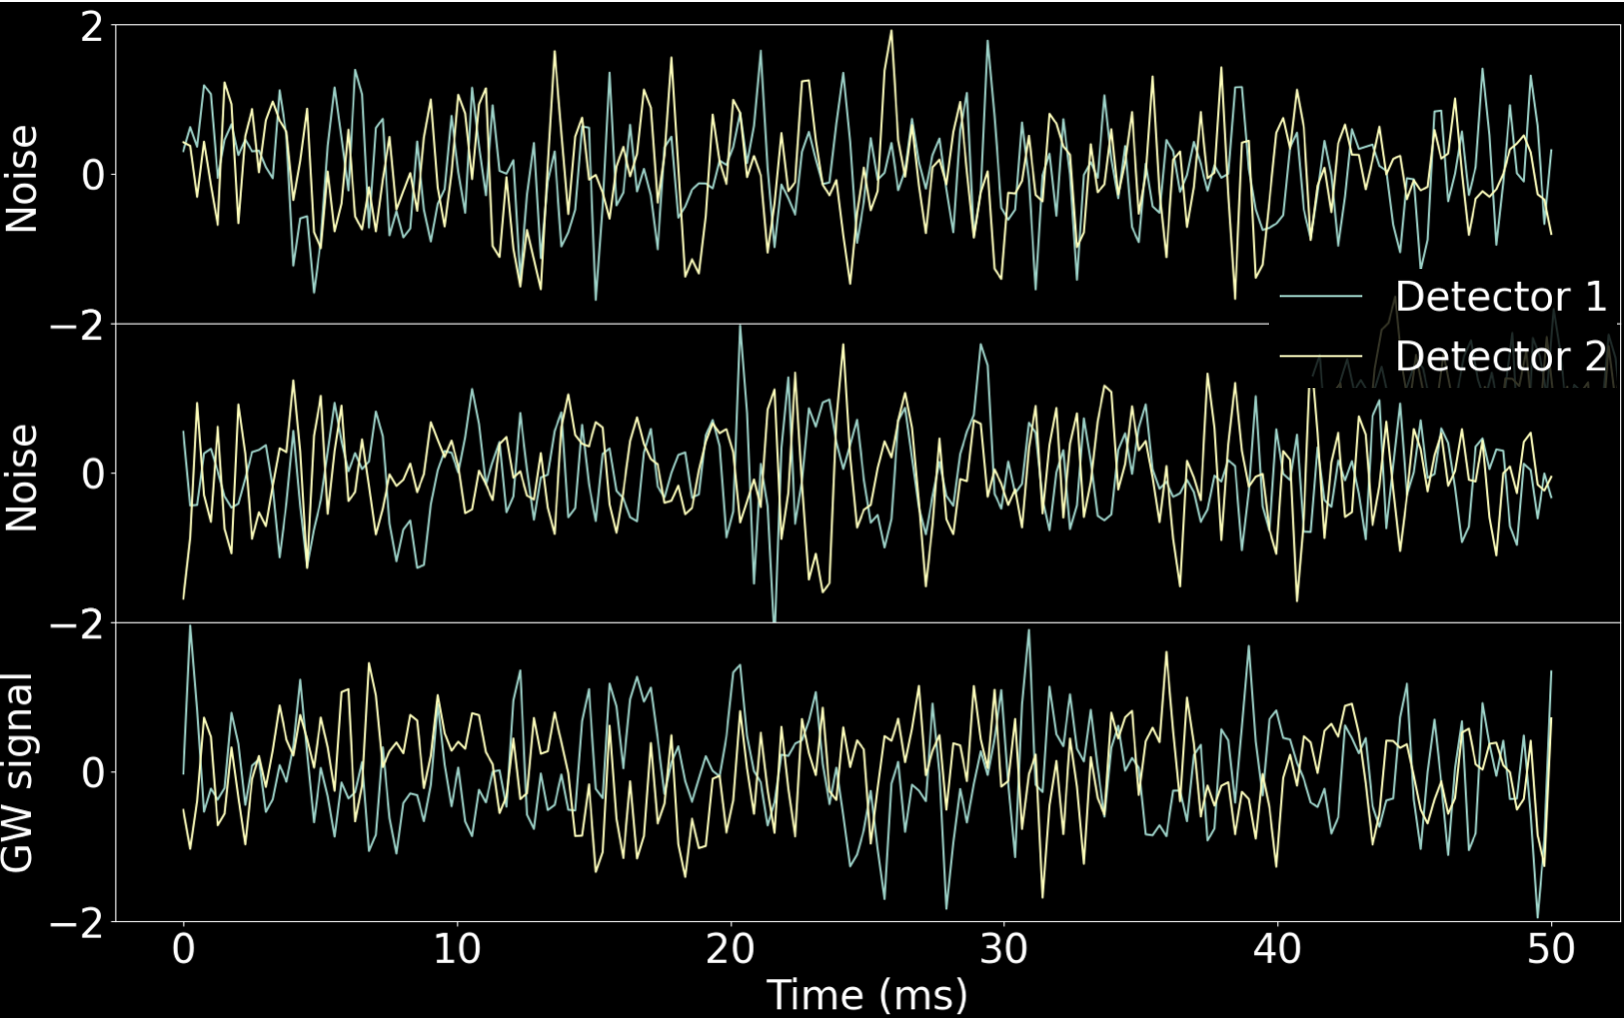 The above figure shows 3 different signals from both LIGO detectors (Hanford and Livingston): the first two are noise, and the bottom one is a real GW signal.
It is difficult to distinguish them by eye.
If the distribution of noise is known (for example, if it is Gaussian), then it is possible to use statistical methods to detect GWs.
However, the noise is not Gaussian, and it is difficult to model it.
In this project, I used a normalizing flow, which is a generative AI model that can parameterize unknown distributions, to learn the noise distribution.
Once the noise distribution is learned, it can be used to detect GWs by looking for outliers in the data.
About Me
I am Lebanese-Armenian born and raised in the beautiful country of Lebanon. I enjoy rock climbing, playing football (soccer), and photography. I love exploring new places.
Contact
My email is ask126@pitt.edu.
